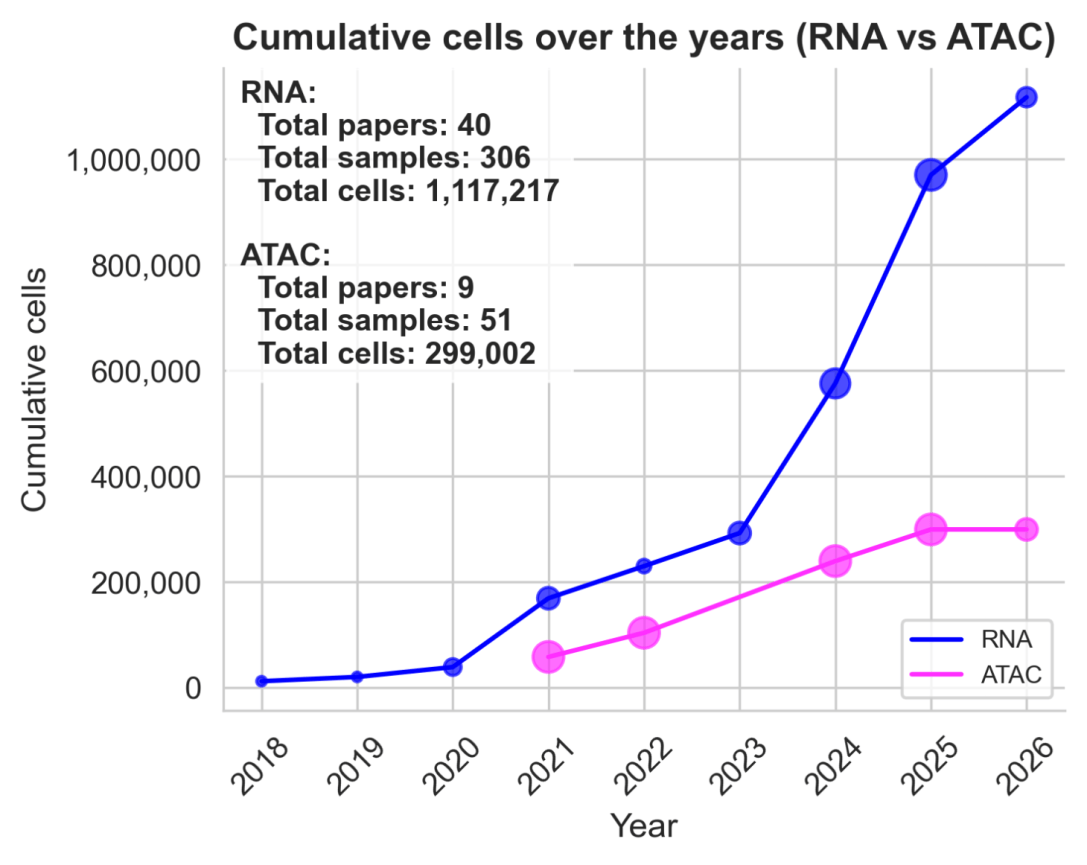
Image: Exponential adoption of single-cell profiling in the pituitary gland.
There isn’t really a proper venue for writing brief updates to existing scientific projects. Publications typically require major novelty and each submitted paper is burden on the crumbling peer-review system. So I’ve decided to make this a blog post, in which I’ll explain some of the updates on our epitome platform (epitome-atlas.com), which has become a central resource for pituitary gland research. I’ll try to write something short like this for each release, so that users can keep track of what’s new.
A brief summary of what’s new in release v_0.03.
User interface
In the near term we will expand to human datasets, and therefore redesigning some aspects of the website was crucial. Along with this, some improvements to the user-interface were also made, which now looks a bit more professional than before.
New data
Added new datasets from Sochodolsky et al. (2026) that were missed in v_0.02, data from Refael et al. (2026), Weber et al. (2026) and Odle et al. 2026.
Find the papers referenced at the bottom of the post.
New datasets have all been annotated automatically with the v_0.02 cell type model (as taken from Kövér et al. 2026).
Updated results
All differential expression analysis (markers, sex and age analyses) have been repeated with the expanded dataset. The added data have further improved the robust findings in the atlas, as I will show below.
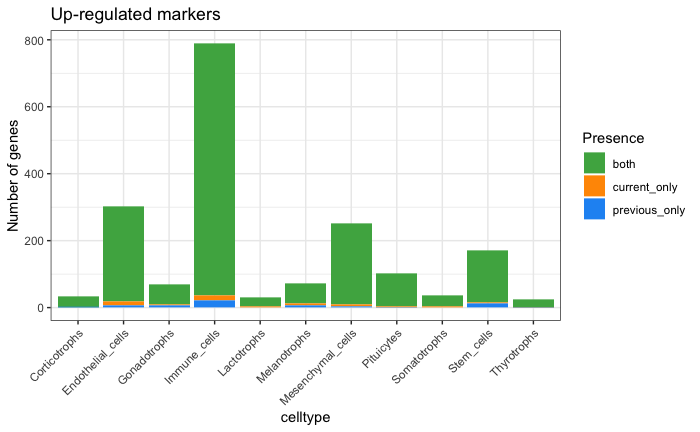
For lineage markers, comparing the various splits in the pituitary lineage (for explanation see Kövér et al. 2026 and the figure below) most markers remained in agreement with the previous version (v_0.02), and more accurate estimates now added (blue) and removed (orange) some markers.
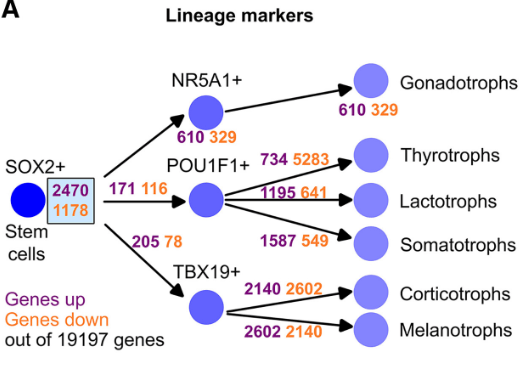
Fig 5A from Kövér et al. 2026
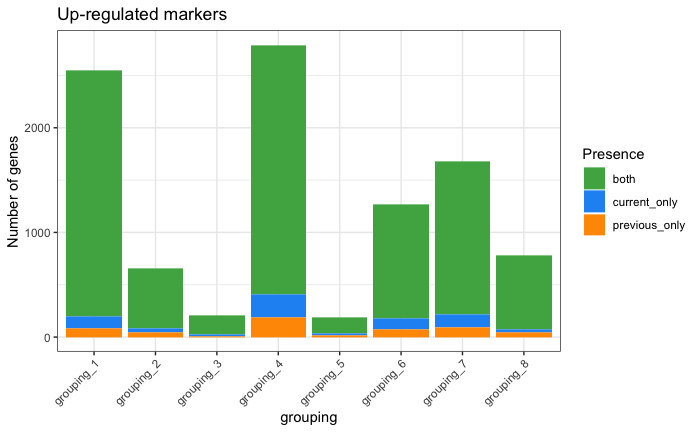
Bar plot of overlapping and changing markers across atlas versions.
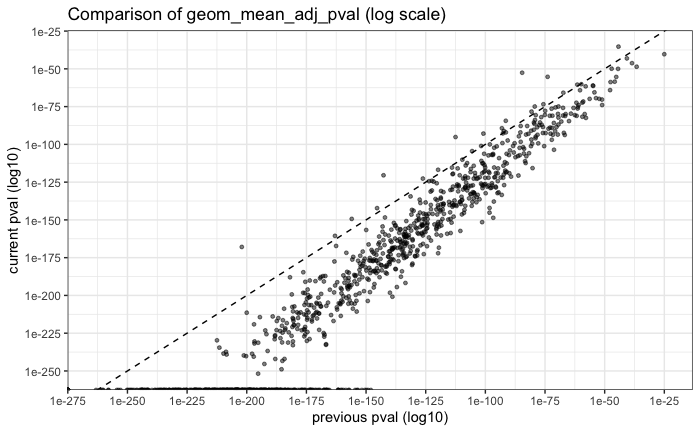
When comparing P-values between versions, we see that now with more data, the P-values tend to be more significant in the atlas, because of course we have stronger statistical support to each claim due to the higher sample size. Overall P-values seem really nicely correlated with the previous version, showing that adding all this new data didn’t totally mess things up, just made findings more significant in general.
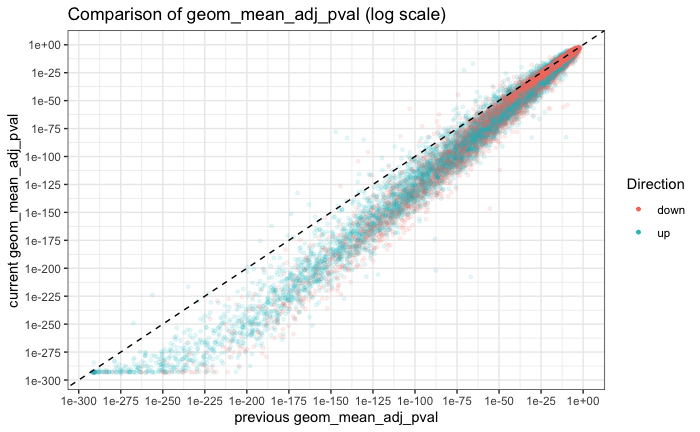
Scatter plot of P-values across atlas versions.
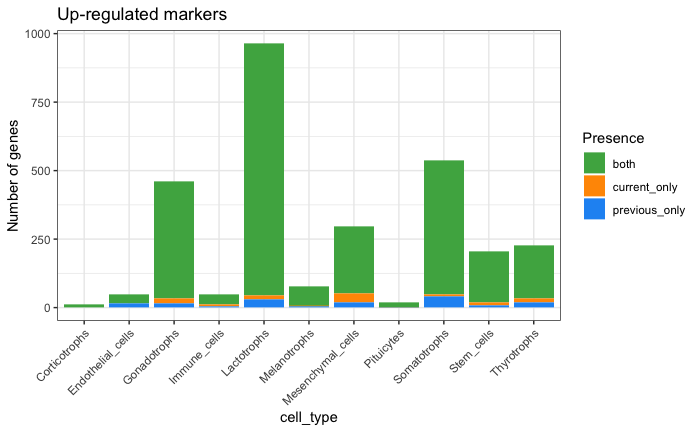
For cell typing markers, the situation is very similar, there is almost a total overlap with the previous (v_0.02) and current (v_0.03) markers.
Bar plot of overlapping and changing markers across atlas versions.
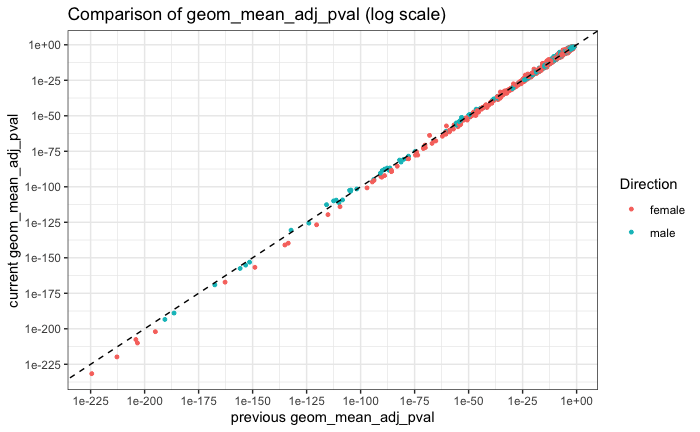
And as before, the P-values are strongly correlated, but typically more significant than before.
Scatter plot of P-values across atlas versions.
For sex-biased gene expression, the findings are also largely consistent with the previous results, with minor adjustments. For this specific analysis, only some of the newly added datasets were used, and none of the Parse biosciences datasets (as in the paper), which previously seemed to have some male-female cross-contamination.
Bar plot of overlapping and changing markers across atlas versions. Upregulated here means male-biased markers. Female-biased markers not shown, but is qualitatively similar.
Here too, P-values are strongly correlated between the two versions, and somewhat more significant in the new version.
Scatter plot of P-values across atlas versions.
For age-dependent changes, there were also slight updates, mostly resulting in slightly higher significance for genes with already clear patterns.
Downloadables
Improved formatting of downloadable objects, by cleaning up their metadata. The AnnData objects now include a tidier .obs metadata section after removing a lot of repetitive junk columns. This should facilitate easier reuse of the datasets. The integrated objects and individual datasets now also include the recently added datasets from this release.
What can one do with all this new data?
I’ve heard very cool use cases from a lot of labs, but one thing in particular that I find exciting with the new datasets (and I don’t have time to look at) is estrous cycle variation across the pituitary cell types. With the added datasets, there is now about 60 or so samples with estrous cycle labels, so someone could definitely find something novel there. If you are interested, get in touch and happy to brainstorm on this.
Closing
Usually single-cell atlases (and most biological resources) are just published but not properly maintained. At least for the foreseeable future I will try to maintain epitome as much as I can, and keep users updated on new features.
Go check out epitome: epitome-atlas.com
Cite the paper
Kövér, B., Willis, T.L., Sherwin, O., Kaufman-Cook, J., Kemkem, Y., Segoviano, M.V., Lodge, E.J., Zamojski, M., Mendelev, N., Zhang, Z., et al. (2026). Consensus Pituitary Atlas, a scalable resource for annotation, novel marker discovery, and analyses in mouse pituitary gland research. Cell Rep. 45. https://doi.org/10.1016/j.celrep.2026.117407.
Papers with the new data
Weber, R., Carilli, M., Rebboah, E., Filimban, G., Liang, H.Y., Trout, D., Duffield, M., Mahdipoor, P., Taghizadeh, E., Fattahi, N., et al. (2026). Hybrid crosses reveal a cell-type-specific landscape of mouse regulatory variation. Preprint at bioRxiv, https://doi.org/10.64898/2026.04.02.716195https://doi.org/10.64898/2026.04.02.716195.
Odle, A.K., Miles, T.K., Herdman, A.K., Clark, L.G., Byrum, S.D., Lagasse, A.N., Haney, A.C., MacNicol, A.M., Childs, G.V., and MacNicol, M.C. (2026). Gonadotrope remodeling in sustained low estrogen states: single-cell transcriptomic analysis reveals gonadotrope subtypes and activation of stem cell populations. Biol. Reprod. 115, 145–160. https://doi.org/10.1093/biolre/ioag091.
Sochodolsky, K., Khetchoumian, K., Balsalobre, A., Feeley, R.M., Rice, M.E., Chakravarty, P., Lovell-Badge, R., Rizzoti, K., and Drouin, J. (2026). BDNF regulates pituitary stem cell engagement toward precursor state. Stem Cell Rep. 21. https://doi.org/10.1016/j.stemcr.2026.102997.
Refael, T., Golan, G., Darsa, D., Pnueli, L., Chakravarty, P., Rizzoti, K., and Melamed, P. (2026). Accessibility at a primed distal Fshb-Kcna4 super-enhancer is facilitated by Foxl2 during gonadotrope differentiation. Endocrinology 167, bqag028. https://doi.org/10.1210/endocr/bqag028.


